Equalization in the Light of MATLAB Simulink

Equalization

Equalization is, the technique, used to keep the balance between frequency components within an electronic signal, i.e. to minimizes ISI.

For many physical channels, such as telephone lines, not only are they band limited, but they also introduce distortions in their passbands. These distortions are generally InterSymbol Interferences (ISI).

Nyquist Condition:

The condition at which there is no InterSymbol interferences (ISI).

Equalizer:

A device which is used to mitigate ISI, which are incurred by the signal when it is transmitted through some channel. It’s also used to improve the performance of the receiver.

Different Types of Equalizers:

There are different types of equalizers which are used on the basis of their functionality. Some of them are listed below:

  • Linear Equalizers
  • Adaptive Equalizers
  • Blind Equalizers
  • Decision Feedback Equalizers
  • Turbo Equalizers
  • Viterbi Equalizers

What is Signal Constellations?

A signal constellation is the physical diagram used to describe all the possible symbols used by a signaling system to transmit data and is an aid to designing better communications systems.

Equalizing a Signal Using MATLAB:

Equalizing a signal using Communications System Toolbox in MATLAB software involves these steps:

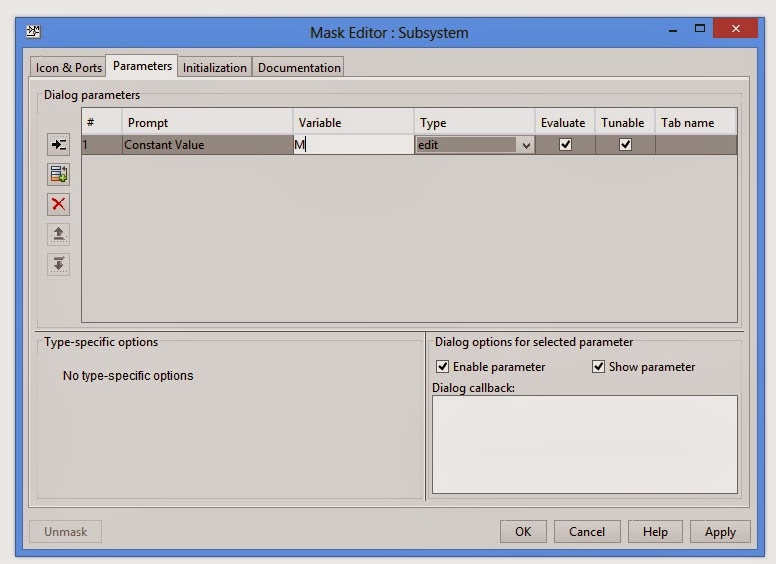
  • Create an equalizer object that describes the equalizer class and the adaptive algorithm that you want to use. An equalizer object is a type of MATLAB variable that contains information about the equalizer, such as the name of the equalizer class, the name of the adaptive algorithm, and the values of the weights.
  • Adjust properties of the equalizer object, if necessary, to tailor it to your needs. For example, you can change the number of weights or the values of the weights.
  • Apply the equalizer object to the signal you want to equalize, using the equalize method of the equalizer object.

Example-“equ.m”:


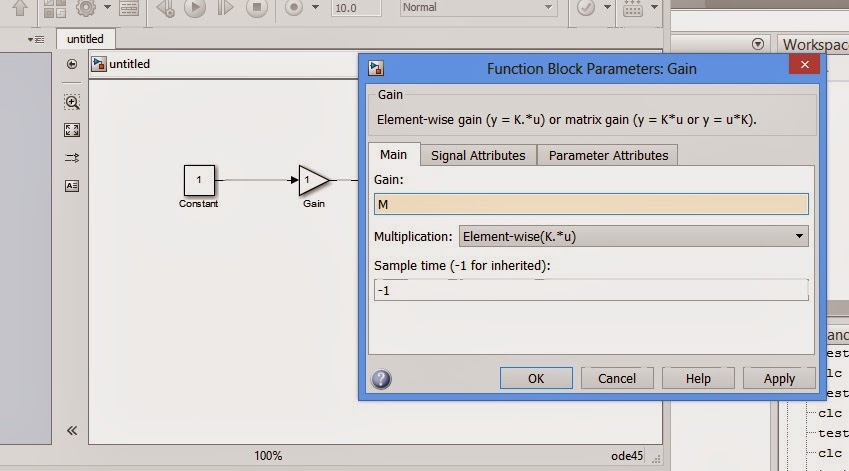
% Set up parameters.
M = 16; % Alphabet size for modulation
sigconst = step(comm.RectangularQAMModulator(M),(0:M-1)’);
% Signal constellation for 16-QAM
chan = [1 0.45 0.3+0.2i]; % Channel coefficients
hMod = comm.RectangularQAMModulator(M); % QAMModulator System object

% Set up equalizers.
eqrls = lineareq(6, rls(0.99,0.1)); % Create an RLS equalizer object.
eqrls.SigConst = sigconst’; % Set signal constellation.
eqrls.ResetBeforeFiltering = 0; % Maintain continuity between iterations.
eqlms = lineareq(6, lms(0.003)); % Create an LMS equalizer object.
eqlms.SigConst = sigconst’; % Set signal constellation.
eqlms.ResetBeforeFiltering = 0; % Maintain continuity between iterations.
eq_current = eqrls; % Point to RLS for first iteration.
% Main loop
for jj = 1:4
msg = randi([0 M-1],500,1); % Random message
modmsg = step(hMod,msg); % Modulate using 16-QAM.

% Set up training sequence for first iteration.
if jj == 1
ltr = 200; trainsig = modmsg(1:ltr);
else
% Use decision-directed mode after first iteration.
ltr = 0; trainsig = [];
end

% Introduce channel distortion.
filtmsg = filter(chan,1,modmsg);

% Equalize the received signal.
s = equalize(eq_current,filtmsg,trainsig);

% Plot signals.
h = scatterplot(filtmsg(ltr+1:end),1,0,’bx’); hold on;
scatterplot(s(ltr+1:end),1,0,’g.’,h);
scatterplot(sigconst,1,0,’k*’,h);
legend(‘Received signal’,’Equalized signal’,’Signal constellation’);
title([‘Iteration #’ num2str(jj) ‘ (‘ eq_current.AlgType ‘)’]);
hold off;

% Switch from RLS to LMS after second iteration.
if jj == 2
eqlms.WeightInputs = eq_current.WeightInputs; % Copy final inputs.
eqlms.Weights = eq_current.Weights; % Copy final weights.
eq_current = eqlms; % Make eq_current point to eqlms.
end
end

The example above illustrates how to use equalize within a loop, varying the equalizer between iterations.

Explanation:

As stated above, the first step in equalization of a signal is “creating an equalizer object that describes the equalizer class and the adaptive algorithm that you want to use.”

Setting up parameters:

First of all, we’ll define the size for modulation, which in this case is:

  1. M = 16; % Alphabet size for modulation

Now we’ll use System object, comm.RectangularQAMModulator, which modulates the signal using M-ary quadrature amplitude modulation with a constellation on a rectangular lattice.

Modulating a signal using quadrature amplitude modulation has two steps:

Calling step to modulate the signal according to the properties of comm.RectangularQAMModulator.

2. sigconst = step(comm.RectangularQAMModulator(M),(0:M-1)’); % Signal constellation for 16-QAM·         Define and set up your rectangular QAM modulator object.

4. hMod = comm.RectangularQAMModulator(M);                                                         % QAMModulator System object

Set up equalizers:

Now we’ll create three equalizer objects:

An RLS equalizer object.

5. eqrls = lineareq(6, rls(0.99,0.1)); % Create an RLS . equalizer object.6. eqrls.SigConst = sigconst’; % Set signal constellation.7. eqrls.ResetBeforeFiltering = 0; % Maintain continuity between iterations.

An LMS equalizer object.

8. eqlms = lineareq(6, lms(0.003)); % Create an LMS equalizer object.9. eqlms.SigConst = sigconst’; % Set signal constellation.10. eqlms.ResetBeforeFiltering = 0; % Maintain continuity between iterations.

Here eqlms is an equalizer object that describes a linear LMS equalizer having six weights and a step size of 0.003.

A variable, eq_current, which points to the equalizer object to use in the current iteration of the loop. Initially, this points to the RLS equalizer object. After the second iteration of the loop, eq_current is redefined to point to the LMS equalizer object.

11. eq_current = eqrls; % Point to RLS for first iteration.

Simulating the System Using a Loop:

The next portion of the example is a loop that Generates a signal to transmit and selects a portion to use as a training sequence in the first iteration of the loop:

% Main loop

  1. for jj = 1:4

13   msg = randi([0 M-1],500,1); % Random message

14   modmsg = step(hMod,msg); % Modulate using 16-QAM.

% Set up training sequence for first iteration.

15   if jj == 1

ltr = 200; trainsig = modmsg(1:ltr);

16   else

% Use decision-directed mode after first iteration.

17      ltr = 0; trainsig = [];

18   end

Introduces channel distortion

% Introduce channel distortion.

  1. filtmsg = filter(chan,1,modmsg)

Equalizes the distorted signal using the chosen equalizer for this iteration, retaining the final state and weights for later use

% Equalize the received signal.

  1. s = equalize(eq_current,filtmsg,trainsig);

Plots the distorted and equalized signals, for comparison

% Plot signals.

  1. h = scatterplot(filtmsg(ltr+1:end),1,0,’bx’); hold on;
  2. scatterplot(s(ltr+1:end),1,0,’g.’,h);
  3. scatterplot(sigconst,1,0,’k*’,h);
  4. legend(‘Received signal’,’Equalized signal’,’Signal constellation’);
  5. title([‘Iteration #’ num2str(jj) ‘ (‘ eq_current.AlgType ‘)’]);
  6. hold off;

Switches to an LMS equalizer between the second and third iterations

% Switch from RLS to LMS after second iteration.

  1. if jj == 2
  2. eqlms.WeightInputs = eq_current.WeightInputs; % Copy final inputs.
  3. eqlms.Weights = eq_current.Weights; % Copy final weights.
  4. eq_current = eqlms; % Make eq_current point to eqlms.

end

end % Main Loop Ended
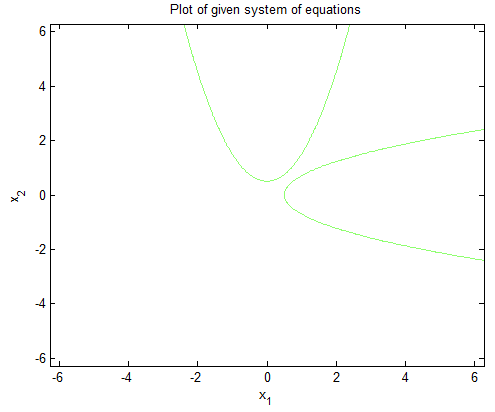
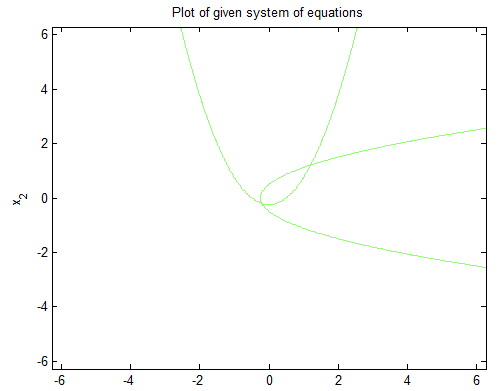
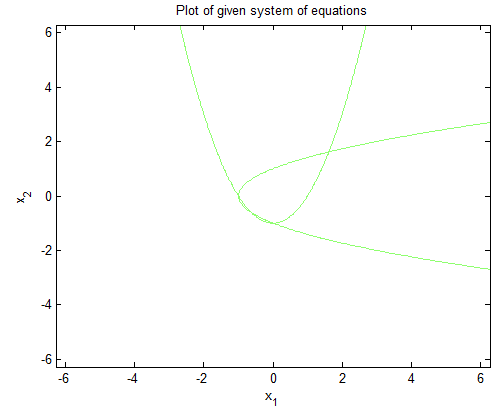
Results:

The example produces one scatter plot for each iteration, indicating the iteration number and the adaptive algorithm in the title. The plot is below:

result

Motors and Generators | A Comparison in the Light of MATLAB SimPowerSystems

Electrical Machines are electromechanical energy converters which produce electrical energy in case of Generators and consume it in case of Motors in order to do some mechanical work.
Types of Machines:
  • Motor 
  • Generator

What are MOTORS?

An Electric Motor is an electrical machine which converts electrical energy into mechanical energy. It’s a very commonly being used electrical machine. Fans, Washing machines, Fridges, Pool pumps, Blender etc. use motor in them.
Types of Motor:
  • DC Motor 
  • AC Motor
While both A.C. and D.C. motors serve the same function of converting electrical energy into mechanical energy, they are powered, constructed and controlled differently. The most basic difference is the power source.
AC Motor: A.C. motors are powered from alternating current (A.C.)
DC Motor: While D.C. motors are powered from direct current (D.C.), such as batteries, D.C. power supplies or an AC-to-DC power converter.

Motor construction

  • Rotor
  • Stator
  • Winding
  • Commutator


 What are GENERATORS?

On the other hand, generator converts the mechanical work into electrical energy. Big turbines or diesel/steam engines are used for this purpose. Generators provide nearly all of the power for electric power grids.

Types of Generator:

  • DC Generator 
  • AC Generator

DC Generator: A DC generator produces an electrical current that flows in only one direction, hence the term “direct current.”

AC Generator: The current produced by an AC generator, also called an alternator, constantly switches directions.

Generator Construction
  • Rotor
  • Stator
  • Winding
  • Commutator (in DC Generator)


Comparison in SimPowerSystems

In MATLAB SimPowerSystems, Motor and Generator both are represented by a single unit called “3-Phase Asynchronous Machine”. Its different models are as follows:

(a)
(b)
                                          
Fig. (a) is a model with squirrel-cage rotor while Fig (b) is modeled with wound rotor. The Asynchronous Machine block implements a three-phase asynchronous machine (wound rotor, single squirrel-cage, or double squirrel-cage). It operates in either generator or motor mode. The mode of operation is dictated by the sign of the mechanical torque, Tm:
  1.  If Tm is positive, the machine acts as a motor.
  2.  If Tm is negative, the machine acts as a generator.

The next figure indicates how to connect an Ideal Torque Source block from the Simscape library to the machine shaft to represent the machine in motor mode, or in generator mode, when the rotor speed is positive.


Inputs and Outputs

The stator terminals of the Asynchronous Machine block are identified by the letters A, B, and C. The rotor terminals are identified by the letters a, b, and c. The neutral connections of the stator and rotor windings are not available; three-wire Y connections are assumed.
Tm
The Simulink input of the block is the mechanical torque at the machine’s shaft. When the input is a positive Simulink signal, the asynchronous machine behaves as a motor. When the input is a negative signal, the asynchronous machine behaves as a generator. When you use the SI parameters mask, the input is a signal in N.m, otherwise it is in pu.
w
The alternative block input (depending on the value of the Mechanical input parameter) is the machine speed. When you use the SI parameters mask, the input is a signal in rad/s or in pu.
m
The Simulink output of the block is a vector containing measurement signals. You can demultiplex these signals by using the Bus Selector block provided in the Simulink library. Depending on the type of mask that you use, the units are in SI or in pu. The cage 2 rotor signals return null signal when the Rotor type parameter on the Configuration tab is set to Wound or Squirrel-cage.

Note:

Nominal Value:
The stated value of an issued security is called nominal value.

Pu Value
For a given quantity (voltage, current, power, impedance, torque, etc.) the per unit value is the value related to a base quantity. Per Unit = Present Value/Base Value

Use of the Asynchronous Machine Block in Motor Mode

Now in this mode if we run the simulation and observe the machine’s speed and torque:


The first graph shows the machine’s speed going from 0 to 1725 rpm (1.0 pu). The second graph shows the electromagnetic torque developed by the machine. Because the stator is fed by a PWM inverter, a noisy torque is observed.

Limitations

The Asynchronous Machine block does not include a representation of the saturation of leakage fluxes. You must be careful when you connect ideal sources to the machine’s stator. If you choose to supply the stator via a three-phase Y-connected infinite voltage source, you must use three sources connected in Y. However, if you choose to simulate a delta source connection, you must use only two sources connected in series.


When you use Asynchronous Machine blocks in discrete systems, you might have to use a small parasitic resistive load, connected at the machine terminals, to avoid numerical oscillations. Large sample times require larger loads. The optimum resistive load is proportional to the sample time. Remember that with a 25 μs time step on a 60 Hz system, the minimum load is approximately 2.5% of the machine nominal power. For example, a 200 MVA asynchronous machine in a power system discretized with a 50 μs sample time requires approximately 5% of resistive load or 10 MW. If the sample time is reduced to 20 μs, a resistive load of 4 MW is sufficient.

Continue reading

Masked systems and masked parameters

In last session we discussed subsystems and some basics of Simulink. Now we are going to discuss masked systems and masked parameters. Our discussion will include following topics

  1. What are masked systems
  2. What are mask parameters
  3. How to mask a system
  4. Mask Editor
  5. How to add picture to masked system
  6. How to add text to masked system
  7. Short cuts
  8. Masked wind turbine system example


1-  What are masked systems

A mask is a custom user interface for a block that hides the block’s contents, making it appear to the user as an atomic block with its own icon and parameter dialogue box. Masked system is associated with the word “mask”. We make a subsystem and encapsulate in any mask. Mask system looks exactly like a built in block of Simulink.

2-  What are mask parameters

Mask parameters are parameters which can be changed by just clicking our mask. We have to keep one thing in mind that mask parameters are defined in the mask workspace, while block parameters are defined in the model or base workspace. So we can’t access parameters which are defined inside our mask outside that masked system.


We can provide access to one or more underlying block parameters by defining the corresponding number of mask parameters. Mask parameters appear in the Mask Parameters dialog box as fields that can be edited. Simulink® applies the value of a mask parameter to the value of the corresponding block parameter during simulation.


3-  How to mask a system

Make a simple Simulink model with a Constant block, Gain block, and a Display block
Set the value of Constant to a variable M.

Make subsystem of these blocks and then convert it into a masked system.

4-  Mask Editor

After creating mask, Mask Editor window appears, in which we can edit our mast according to our requirements. Following tab in Mask Editor are of our concern:  

Prompt

We have to put some name or anything and that name will be appeared in masked system outlook. Like in our case we write Constant value, now that Constant value option will be shown when anyone clicks masked system.

Variable

Whatever value we enter in mask parameter will be assigned directly to variable name written in that place. As we want to change variable ‘M’ (used in constant block) with our masked parameter  so we put variable name here as ‘M’. 
In our example we are just using one variable, but we can use as many variables as we want.
Now we have completely masked our system. Masked systems are recognized by a small arrow pointing downwards. Double click the masked system to insert value of ‘G’.
Outlook of a masked system


Putting value of constant G in masked system

Now we can see that same value is going into Constant block  which we are inserting here. We can check inside of masked system by clicking option Look inside mask.


5-  How to add picture to masked system

We can  add any picture of our choice so that our system looks like a built in block and anyone can know function of our system by just looking at it. Add picture as follows:

Mask——-> Edit Mask———-> Icons————> image(imread(‘images.jpg’))
Now we can see that our system looks like a built in block of Simulink.
Masked system looking like a built in library block
We can  write any text of our choice which could depict nature of our masked system. Like if we are going to implement some equation in masked system, we can display that equation by going into icon panel and entering below command :
 
disp(‘{\itEquation:}\alpha^2 + \beta^2\rightarrow \gamma^2,\chi,\phi_3= {\bfcool}’, ‘texmode’,’on’)

Masked System with text at its outlook

6-  Short cuts

Create Subsystem——–>    Ctrl+G
Create Mask————->    Ctrl+M
Edit Mask—————->    Ctrl+M
Look under Mask——– >   Ctrl+U

7-  Masked wind turbine system example

Following example is a masked parameter of a wind turbine. We can see that a lot of parameters can be set in that model by just putting values in our mask without going inside messy model.


Thanks a lot for your time 🙂
For projects/paper implementations and one to one online training……


Creation of a subsystem and some other basics of Simulink modelling

Dear All,
We are going to discuss basic thinks about Simulink modelling, so when we move towards advance things, no one will get trouble in absorbing those things.
Today we will cover the following topics:

  1. How to make a new Simulink model
  2. How to insert blocks
  3. How to format different blocks
  4. What is Subsystem
  5. How to make Subsystem
  6. Short cut to make subsystem

1-  How to create a Simulink model

Run Matlab and do following steps:
New—————-> Simulink Model

Once Simulink model is opened, save it with any appropriate  name, like I have saved it with name “basic1.slx”. Please note that .slx extension is only available for Matlab 2012 and latest versions, if you are using any old old version you should save with .mdl extension.

2-  How to insert and format different blocks

After saving your model, open Simulink library and insert different components according to your requirements. Right now I am using simple Constant block, Gain block , and Scope to display results.

We can put any value in Constant block, that value will be multiplied by Gain value to give final value.

Results or graphs can be observed using Scope. Double click scope block to see results.

3-  How to format different blocks

Sometimes we have to rotate or flip some blocks or sometimes whole system, it can be done as follows:
Background and foreground colour of blocks/ system can be changed as follows:
Besides method shown upward, we can also use short cuts for flipping or rotating a block.
Ctrl+I              —————————->  Invert Block
Ctrl+R            —————————-> Clockwise rotation
Ctrl+Shift+R  —————————-> Counter-clockwise rotation


4-  What is a Subsystem

Sometimes our model becomes too much messy and we want to divide whole model in different parts or subsystems to give handy and uncomplicated look to our model. Mostly we group together elements/blocks performing allied functions. Like if some components are part of a machine, we will encapsulate them in “Machine” block, if some components/blocks are used to make an inverter we will group them in subsystem “Inverter

5-  How to make a Subsystem

A subsystem can be made by selecting all components that are supposed to be grouped in one subsytem and then following steps.


6-  Short cut to make subsystem

Subsystem can be formed by using short-cut Ctrl+G
Following figure is a snapshot taken from one of my  project. You can see that  whole system is divided into different subsystems.

I hope that post is useful for users who are newbies in Simulink. In next session we will discuss about masked systems and masked parameter. If you have any queries, feel free to ask. Thanks
 

For projects/paper implementations and one to one online training……


Finding Jacobi matrix for system of non linear equations using Newton’s method in Matlab

In that question we will solve a system of non linear equations by Newton’s method and then find Jacobi matrix for different values. We will also show outputs and graphs for all the values.

 
Question


Solution

Write down the following code
Write the equation in the form of a matrix and save it as a function equation.m.
functionF=equation (x)
c1=0.5;
c2=1/4;
c3=-1/2;
c4=-1;
% Write system of equations
 F(1,1) = x(1)^2 – x(2) +c1;
 F(2,1) = x(2)^2-x(1)+c1;
return
Find the Jacobean of the above system by using following function.
function J=jacobi (x)
%Jacobian is the derivative of each term of matrix
J(1,1) = 2*x(1); J(1,2) = 2;
J(2,1) = -1; J(2,2) = 2*x(2);
return
Write that function and save it in same MATLAB directory which is being used for work.
function [x,F,counter] = mynewton (equation ,jacobi ,G ,tol ,iter , varargin )
%This function finds a zero of a nonlinear system of equations
%Input: Given system of equations, jacobian matrix, initial guess, iterations
%  counter returns the number of iterations
counter = 0; error = tol + 1; x = G;
while error >= tol & counter < iter
J = feval(jacobi ,x,varargin {:});
F = feval(equation ,x,varargin {:});
delta = – J\F;
x = x + delta;
error = norm (delta);
counter = counter + 1;
end
if (counter== iter & error > tol)
fprintf ([‘ Fails to converge within maximum ‘ ,‘number of iterations .\n’ ,’The iterate returned has relative ‘ ,‘residual %e\n’],F);
else
fprintf ([‘The method converged at iteration ‘ ,‘%i \n’],counter );
end
return
Write down the following lines in MATLAB script file to get solution.
% G is our initial guess, iter = number of iterations
%counter= specific number of iteration at any count
G =[0; 1]; tol =1e-15; iter =100;
% % Call mynewton function to find out zeros of given system
% [x,F,counter] = mynewton (@equation ,@jacobi ,G ,tol ,iter );
 x
 display (‘Jacobian matrix is given as:      ‘)
 J=jacobi(x)
[x,iter] = newtonm(G,@equation,@jacobi)
 syms x1 x2
 figure
% Draw the plot and find out point of intersection of 2 equations
  ezplot(x1^2+2*x2-2==0)
  hold on
  ezplot(x1+4*(x2^2)-4==0)
  title (‘Plot of given system of equations’)


Output
>> call
 Fails to converge within maximum number of iterations .
’ ,’The iterate returned has relative residual 3.870060e+01
 Fails to converge within maximum number of iterations .
’ ,’The iterate returned has relative residual 2.122554e+00
x =
    3.5229
    1.9502
 
It is clear from the out and from the plot that the system has no solution at c=0.5, as two parabolas are not intersecting each other.
Now check for other parameters i-e c=0.25,-0.25, -1. All code will remain same only values of c would be changed in following function.
 
functionF=equation (x)
c1=0.5;
c2=1/4;
c3=-1/2;
c4=-1;
% Write system of equations
 F(1,1) = x(1)^2 – x(2) +c1;
 F(2,1) = x(2)^2-x(1)+c1;
  return
 Now outputs and plots for c=1/4,-1/2, -1 will be as follows.
  
C=0.25
Output
>> call
 Fails to converge within maximum number of iterations .
’ ,’The iterate returned has relative residual 4.541221e-04
 Fails to converge within maximum number of iterations .
’ ,’The iterate returned has relative residual 2.291165e-08
x =
    0.5150
    0.5148
 
  
c=-0.5
Output
>> call
The method converged at iteration 13
x =
    1.3660
    1.3660
 
c=-1
Output
>> call
The method converged at iteration 11
x =
    1.6180
    1.6180


For projects/paper implementations and one to one online training……

Customize scope to add additional toolbox in it

Hi guys,
Most of the times we need to copy results (graphs etc) from scope for thesis or other documentations, but in scope there is no way to copy or edit figure. Now you can turn your scope figure to a Matlab plot simply by typing  two short commands in Matlab command windows. Lets check it out how does it really happen.

Steps:

1-  Create a simple Simulink model by dragging “Sine Wave” block as signal generator and a ‘Scope’ for displaying output.

2-  Open ‘scope’ to check the graph. You can see that there is no option of copying, editing, rotating and other such options in scope.

3-  Now type these two commands on command window and check results again (without re-simulating Simulink model )
set(0,‘ShowHiddenHandles’,‘on’)
set(gcf,‘menubar’,‘figure’)


4-  Now you can see there is a complete new tool box being opened, with many options like copy figure, save as, rotate figure, edit figure and a lot of others. Now you can use these scope figures anywhere with your ease 🙂