
The main purpose of today’s blog is to familiarize you with ANN toolbox environment in MATLAB. First we will briefly discuss its basic concept and then we will see how to use ANN on your customized data such that you can make predictions on any sort of data that you come across during testing phase (detailed examples of classification and regression are given at the end). The ANN toolbox is a simple yet extremely efficient tool that comes with MATLAB and is used in a variety of Machine Learning and Artificial Intelligence applications. Its simple, user friendly interface can help you get your code running in no time. We are here to guide you through the process.

Neural computing is the study of networks of adaptable nodes which, through a process of learning from task examples, stores experimental knowledge and makes it available for use- in simpler words its nothing but enabling your application to learn from samples of past instances.
Human brain works on past experience. Lets take a simple example before we go into technical details. When a baby is born, imagine that’s like an untrained Neural Network model. Over time, he sees the world around him and learns from his family and environment (the NN model is trained). If he is raised with the right kind of training, then he will be a sensible adult, capable of making good decisions. The older he is, the wiser he will get. But this is only the case if he is trained correctly. If he is brought up in a mob of gangsters, he would be disastrous at making right choices, no matter how old he gets or how much experience he has obtained. He would not know difference between right and wrong. Similar is the case of Neural Networks. If past experience is vast (a lot of training data), then our network will be more intelligent in making decisions- just like an older person can make much more sensible decisions than a child, just because he/she has had more past experience to learn from. Another thing to be considered is that the training data should have good samples, only then will your model make correct predictions for new data. There is no use of extensive training data if most of its samples are bad. By ‘bad samples’ what I mean is that the outputs are not properly in accordance with the inputs.
Now what do you think would be the case for an NN model such that some of its training samples are good and some are bad? Well, that would give you a really messed up child. At times it would make good predictions, at other times, pathetic. That would be a very confused individual indeed.
So our today’s blog comprises of the following sections:
- What is artificial neural network?
- What is its application now a days?
- Why do we use it?
- How to use it?
What is an Artificial Neural Network?
Human brain works on the basis of basic elements called “neurons”. Neurons convey information via pathways and by transferring this information our brain solves problems. ANN is a combination of artificial neural networks which are interconnected to achieve desired results. It is based on the neural structure and function of brain.

What exactly is the purpose behind using a Neural Network?
There are two different kinds of Neural Networks: one works as a classifier (pattern recognition) and the other works as a predicting or forecasting tool (net fitting tool). Let’s see examples to get a better understanding:
Classification:

Regression:

Classification by Neural Network- A MATLAB Example
There are 3 species (classes) of iris flowers:
- setosa
- versicolor
- virginica
The type/specie of this flower is determined based on the following four properties: sepal length, sepal width, petal length and petal width.
Each flower has these four attributes on the basis of which a class label is assigned to it (1, 2 or 3).
Suppose you have the data for 150 different flowers. Each flower is described in one column (so the dimensions of this matrix would be 4×150). Each column represents a new flower sample and the four rows represent sepal length, sepal width, and petal length and petal width respectively of the flower in that particular column.this 4×150 matrix is called your feature matrix.
Also, you will need another matrix of targets (classes). It will be a 1×150 row vector like this:
targets= [1 1 1 1………..2 2 2 2…………3 3 3 3]
In this data of ours we have 50 samples per class.
Now, you know the features and corresponding labels of these 150 flowers. Suppose you find three more flowers in your garden and you want to know to which class each flower belongs to.
The first flower has the four features: 6.0000 3.0000 5.0000 2.0000.
The second flower has the four features: 5.0000 3.0000 1.0000 0.1800
The third flower has the four features: 6.0000 3.0000 4.0000 1.2900
There are the two main steps:
- Give the features and class labels of the training data to an NN model.
- Give the testing features (of the three new flowers) to the model and it will tell you the category to which they belong to.
Now, problem is this that Neural Network Toolbox of Matlab can only recognize a target matrix in terms of 0s and 1s. So if your target matrix was of the form ‘targets’ (with 1s and 2s and so on) shown above, then do this:
irisTargets= full ( ind2vec ( targets ) ) ;
Let’s look at sample number one in the workspace:


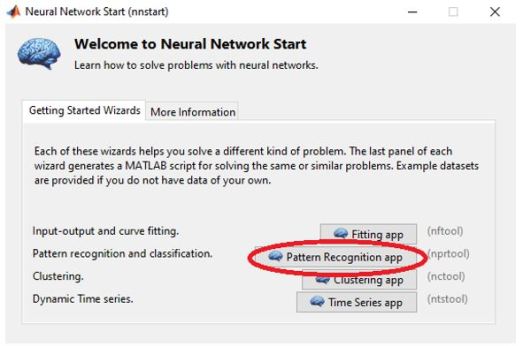
To open ANN toolbox, write “nnstart” in command window and select Pattern Recognition app

The iris example we are considering is a built in example of this toolbox. So we will load the data from here (In this sample data, the targets are already in the form of 0s and 1s).


(Note: Here in this data set, we have each new sample in a new column- for the feature and target matrix both. If the data you have, has each sample in a new row then select that corresponding radio button. Only then will you be able to select the feature and target matrix from the above drop down menu)


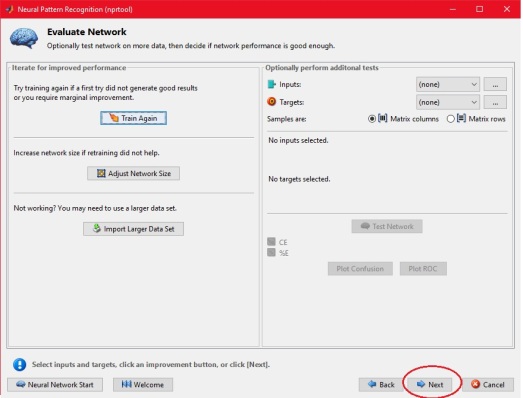
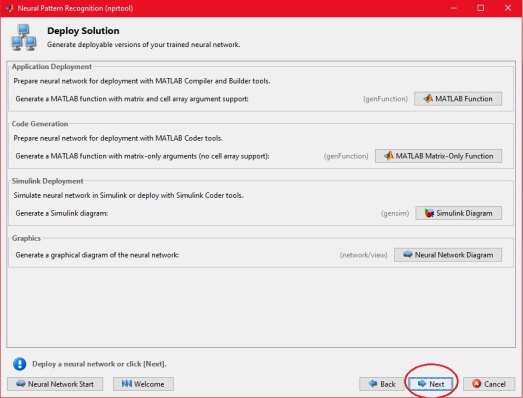

Generating a simple script enables you to save all this effort of yours into a Matlab script file. Run it and see the workspace.
Now, let’s get back to our original problem: we have to identify the classes of the three new flowers that we had found. Our training data matrix had each sample in a different column. So we also have to arrange the testing data, with each sample in a different column.

Now we move on to the final step of testing the new samples by giving them to the formed network.
t=net(testdata);
This command will return the labels like this:

Now thing is, if I just look at this above matrix, it doesn’t make much sense at all. So how do we decipher it? It’s simple actually. You know that each column represents a different sample. See the first column. The maximum value in this column is in the 3rd row. So that means that our first testing sample belongs to 3rd class (Virginica). Similarly, the second and third samples belong to 1st and 2nd classes respectively.
There is a simpler way to convert this type of predicted matrix into one that you can intuitively understand.
tind=vec2ind(t’)

Now that’s Neural Network classification for you. If you want to check the accuracy of classification, you will need to know the actual labels of your test data, then you can compare them with the predicted labels. If the original labels are represented by the variable ‘yind’ and predicted ones by the variable ‘tind’, then:
percentAccuracy = sum(tind == yind)/numel(tind);
Regression by Neural Network- An Example
In simple words, regression just means predicting the future or missing trends from your data. For example, suppose if you have the electricity load data from 2000 to 2015. Somehow you lose the data of the year 2010 to 2012, and want to recover it- that process would be regression (interpolation). If you want to predict the electricity load for the future years, 2016-2020, that is also called regression (extrapolation).
Let’s consider a simple example. In a certain town, the prices of a house depend upon 13 different factors:
- Per capita crime rate per town
2. Proportion of residential land zoned for lots over 25,000 sq. ft.
3. Proportion of non-retail business acres per town
4. 1 if tract bounds Charles River, 0 otherwise
5. Nitric oxides concentration (parts per 10 million)
6. Average number of rooms per dwelling
7. Proportion of owner-occupied units built prior to 1940
8. Weighted distances to five Boston employment centres
9. Index of accessibility to radial highways
10. Full-value property-tax rate per $10,000
11. Pupil-teacher ratio by town
12. 1000(Bk – 0.63)^2, where Bk is the proportion of blacks by town
13. Percent lower status of the population
There is no clear cut formula that defines the relationship of the price with these parameters. We know these 13 factors and corresponding prices of 500 houses but do not know any direct relation between them.
Now there are 2 more houses whose price we must estimate given the 13 factors. The 13 factors for the two new houses are these:

Write “nnstart” in command window, following window will pop up: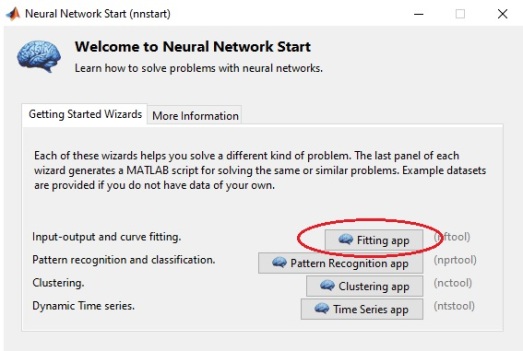
Rest of the process the same, just select house pricing data set from samples.

After auto generating the code, you can test and train on any custom data that you like, be it of a single house or of multiple houses. Just run the auto generated script, then type
predicted_prices= net(new_houses)
On the command window and you will see the predicted price of these 2 new houses:

So that was our today’s blog. We hope it helped you in getting a good understanding of the use of ANN toolbox. If you have any queries, feel free to ask us.
Contact us for all type of R&D projects and training on digital image processing, speech processing, Computer Vision, Robotics. AI, Machine learning, Data analysis, time series problems, regression, forecasting, numerical computation, electrical power systems, renewable energy, control systems, digital communication systems, bioinformatics and others.
We are proficient in: PCA. ICA, DCT, Gabor filters, wavelet transforms, LBP, LPQ, SIFT, SURF, HMM, MFCC,
Artificial Neural Networks, Fuzzy logic, Neuro-fuzzy, SVM, KNN, LDA, Bayesian naïve, Deep learning,
Genetic Algorithm, Ant colony optimization, PSO, IDE, Frog leap, Cuckoo algorithm,
Solar panel (with mppt techniques), Wind turbine, Electrical machines, High voltage systems, Smart grid system, Different IEEE buses,
LTE, Wimax, OFDM, Estimation and equalization techniques, Zigbee, GSM, CDMA and a lot of others.
Like and share our Facebook page with your friends:https://www.facebook.com/matlabexperts
https://www.facebook.com/xpertsvision/
Check a few of our projects at: http://www.eveati.com/portfolio.html
Keep visiting our blog to get valuable information:https://xpertsvision.wordpress.com/
Share your queries/problems at:
Email: expertsvision@live.com
Contact numbers:
+966580031992 (Saudi Arabia)
+923345301505 (Pakistan)
+925187313856 (Pakistan)
+212610737228 (Morocco)
+16137106075(Canada)
WhatsApp: +966590815192
